Climate Change and Length of Growing Season in 20th Century
Length of growing season is the length of time during the year that soil temperature and moisture are suitable for crop growth. It depends primarily on local temperature and precipitation. In this section the pattern of annual growing season lengths on current cropland during the 20th century are estimated and evaluated. Both long-run trends in length of growing season and their potential interaction on length of growing season during El Niño/Southern Oscillation (ENSO) cycles are assessed.
4.4.1.1 Length of Growing Season on All Land
Yearly series of growing season lengths for 1902 through 1997 were derived from a global data set of monthly surface temperature and precipitation extending from 1901 to 1997 over global land areas excluding Antarctica. The data set was prepared by the University of East Anglia'sClimate Research Unit. Meteorological data are from an updated version of the data set described in New et al. (2000). Growing season is calculated with a soil temperature and moisture model developed by USDA's Natural Resource Conservation Service from monthly surface temperature and precipitation (Eswaran et al., 1995). The geographic resolution of the meteorological data and estimated length of growing season is 0.5° latitude-longitude grid boxes.
Estimated changes in growing season lengths are derived from regression models. (Details of the regression analysis are available from the authors upon request.) Independent variables include a trend term for average climate-induced changes in growing season length and terms for El Niño and La Niña, the two components of the ENSO cycle. El Niño and La Niña intermittently lengthen or shorten growing seasons in some regions. Two different ENSO indices — the Southern Oscillation Index (SOI) and the Cold Tongue Index (CTI) — are used in the analysis. The SOI, which is the traditional measure of ENSO cycles, is defined as the normalized Tahiti pressure minus the normalized Darwin pressure (Ternberth,
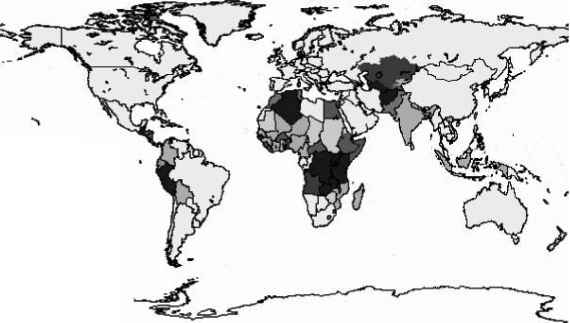
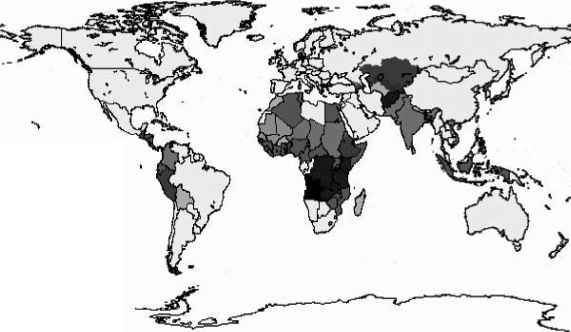
1984). The CTI was formed by subtracting the sea surface temperature (SST) averaged over all 2° latitude-longitude grid boxes within a rectangle defined by 6°N-6°S, 90°-180°W from the global mean SST (Mitchell and Wallace, 1996). Confidence levels of parameters were based on Student t or F statistics as appropriate. Parameters were considered statistically significant if the probability level is equal to or greater than 5% (two-tailed test). The location and direction of statistically significant trends are presented in Figure 4.3. Statistically significant parameters were used to compute the average change in length of growing season (in days) from 1902 to 1997 and the impact (in days) of an average ENSO event.
4.4.1.2 Length of Growing Season on Current Cropland
农田面积按国家和0.5°latitude-longitude grid boxes was compiled from a 1-km-resolution, global land-cover characteristics database generated by U.S. Geological Survey, the University of Nebraska-Lincoln, and the European Commission's Joint Research Centre (U.S. Department of Interior, 2000). Cropland area by country was calibrated to data on arable land in 1997 (FAO, 2003b). Combining cropland location with growing season changes allowed for estimation of how much longer or shorter 1997 cropland growing seasons were relative to 1902 growing seasons, both in total and in areas simultaneously affected by the ENSO cycle. The latter provide information about changes in extreme events. Areas in which growing seasons were shortened by both climate change and ENSO, for example, become more susceptible to intermittent crop failure over time because the probability of reaching minimum growing season lengths declined.
Estimates of current cropland areas in low-income countries that were affected by climate-induced changes in growing season during the 20th century appear in Table 4.3. Estimates vary somewhat depending on which ENSO index was included in the regression models. The greatest difference occurred in Asia. For this region, SOI-based models indicated
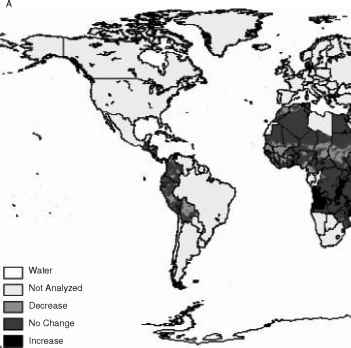

[ I Water I ) Not Analyzed [ ! Decrease I I No Change Increase
Figure 4.3 Impacts of climate change on growing seasons in selected low-income countries, 1902-1997: confidence and direction. 3A. Estimated from regression models using the Southern Oscillation Index for the El Niño/Southern Oscillation cycle. 3B. Estimated from regression models using the Cold Tongue Index for the El Niño/Southern Oscillation cycle. ¡2
Table 4.3 Current Cropland in Low-Income Countries Affected by Climate-Induced Changes in Growing Season, 1902 to 1997, by Region
Region
Sub-Saharan Africa North Africa Asia
Latin America and
Caribbean Former Soviet
Republics Total
Length of Growing Season (Models with SOI for ENSO)a (1000 ha)
Longer |
Shorter |
11,917 |
40,963 |
1,597 |
7,931 |
38,347 |
27,828 |
443 |
8,041 |
7,729 |
4,320 |
60,033 |
89,093 |
Length of Growing Season (Models with CTI for ENSO)b (1000 ha)
Longer |
Shorter |
11581年 |
52,279 |
1,820 |
8,171 |
21,146 |
51,688 |
539 |
8,668 |
11,758 |
2,461 |
46,844 |
123,267 |
Notes: CTI = Cold Tongue Index; ENSO = El Niño/Southern Oscillation; SOI = Southern Oscillation Index.
a Estimated from regression models with the Southern Oscillation Index for the
El Niño/Southern Oscillation cycle. b Estimated from regression models with the CTI for the ENSO cycle. Source: From U.S. Department of Agriculture, Economic Research Service. 2003.Food SecurityAssessment. Agriculture and Trade Report, GFA-14. U.S. Department of Agriculture, Washington, DC.
that more cropland had longer growing seasons, while CTI-based models indicated that more cropland had shorter growing seasons. Estimates for the other regions were similar. In total, the SOI-based models estimated that length of growing season increased (relative to 1902) on 60 million ha of 1997 cropland, but decreased on 89 million ha of 1997 cropland. The CTI-based models estimated that length of growing season increased on 47 million ha of 1997 cropland, but decreased on 123 million ha of 1997 cropland.
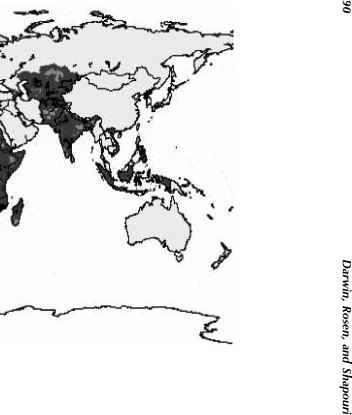
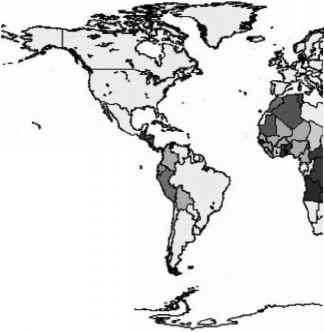
平均估计气候变化的影响raybet雷竞技最新length of growing seasons for 1997 cropland by country during the 1902-1997 period are depicted in Figure 4.4. The percent change in average length of growing season in a given country was equal to the average percent change in growing season on cropland affected by climate change multiplied by the share of cropland affected. Both the SOI- and CTI-based models estimate similar impacts. Except for India, both estimates for a country either have the same sign or one estimate is zero.
Using these criteria, climate change was associated with shorter growing seasons in 40 of the 69 countries evaluated. Regionally, climate change was associated with shorter growing seasons in 21 of 36 countries in Sub-Saharan Africa, 2 of 4 countries in North Africa, 5 of 10 countries in Asia, 10 of 11 countries in Latin America and the Caribbean, and 2 of 8 countries among the former Soviet republics. According to this model, climate change was associated with longer growing seasons in 24 countries, and had no impact on growing seasons in 4 countries. Impacts in one country, India, were uncertain because SOI-based models estimated longer growing seasons on average, while CTI-based models estimated shorter growing seasons on average.
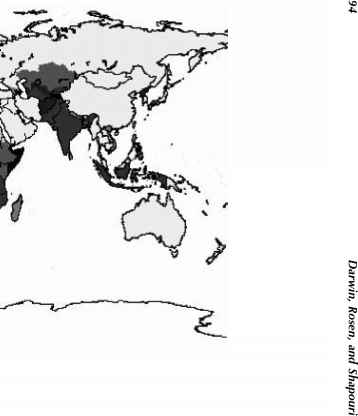
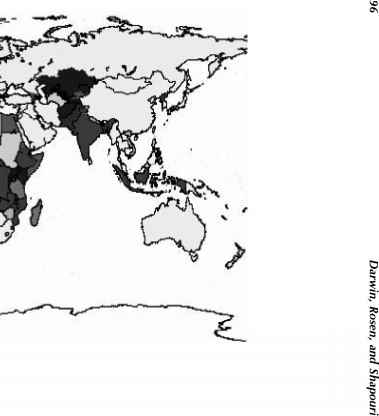
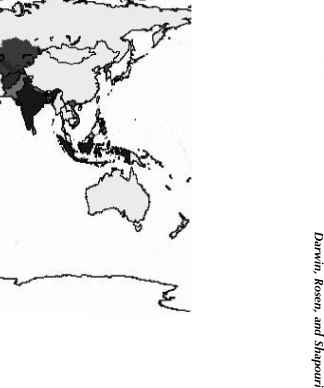
Figures 4.5 and 4.6 indicate how the interaction of climate change with El Niño and La Niña affect average length of growing season on 1997 cropland by country during the 1902-1997 period. Percent change in average length of growing season in a given country was equal to the average percent change in growing season on cropland affected by both climate change and the ENSO cycle multiplied by the share of cropland affected. Estimated impacts from SOI- and CTI-based models were fairly similar to one another. For 49 countries, both estimates of climate change impacts either had the same sign or one estimate was zero. For 12 countries, both estimates of climate change impacts were zero. For eight countries estimates of climate change impacts had opposite signs.
The lighter shades indicate countries for which both climate change and the ENSO cycle were estimated to shorten growing seasons. El Niño and climate change, for example, shortened growing seasons in 16 countries in Sub-Saharan Africa, 5 countries in Asia, and 5 countries in Latin America (based on the assumption that both estimates of climate change impacts either had the same sign or that one estimate was zero). Of these, nine were shortened by more than 2%: Chad, Eritrea, Ivory Coast, Mauritania, Sudan, Zimbabwe, Sri Lanka, Ecuador, and Haiti. La Niña and climate change

水
Not Analyzed □ < -10 % ~1 -10 to -6 % I -5 to -1 % No Change 1 to 5 % 6 to 10 % > 10 %
Figure 4.4 Impact of climate change on cropland growing seasons in selected low-income countries, 1902-1997 (average percent change, by country). 4A. Estimated from regression models using the Southern Oscillation Index for the El Niño/Southern Oscillation cycle. 4B. Estimated from regression models using the Cold Tongue Index for the El Niño/Southern Oscillation cycle.
i I Water
Not Analyzed I | Short Shorter > 2 % ^ Short Shorter < 2 % "31 Long Shorter > 2 % J Long Shorter < 2 % | No Change B Short Longer < 2 % | Short Longer > 2 % | Long Longer < 2 % Long Longer > 2 %
I_I Not Analyzed
I I Short Shorter > 2 % [ ¡ Short Shorter < 2 % I I Long Shorter > 2 % I I Long Shorter < 2 % [ I No Change
Short Longer < 2 % Short Longer > 2 % Long Longer < 2 % Long Longer > 2 %
Figure 4.5 Impact of climate change (Short/Long) and El Niño (Shorter/Longer) on cropland growing seasons in selected low-income countries, 1902-1997 (average percent change, by country). 5A. Estimated from regression models using the Southern Oscillation Index for the El Niño/Southern Oscillation cycle. 5B. Estimated from regression models using the Cold Tongue Index for the El Niño/Southern Oscillation cycle.

水
Not Analyzed [ | Short Shorter > 2 % ^ Short Shorter < 2 % ^ Long Shorter > 2 % J Long Shorter < 2 % | No Change ^ J Short Longer < 2 % | Short Longer > 2 % | Long Longer < 2 % Long Longer > 2 %
水
Not Analyzed
[ 1 Short Shorter < 2 % I 1 Long Shorter > 2 % _ _ Long Shorter < 2 % : No Change Short Longer < 2 % Short Longer > 2 % Long Longer < 2 % Long Longer > 2 %
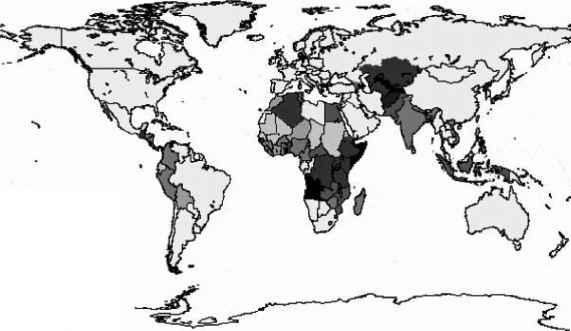
Figure 4.6 Impact of climate change (Short/Long) and La Niña (Shorter/Longer) on cropland growing seasons in selected low-income countries, 1902-1997 (average percent change, by country). 6A. Estimated from regression models using the Southern Oscillation Index for the El Niño/Southern Oscillation cycle. 6B. Estimated from regression models using the Cold Tongue Index for the El Niño/Southern Oscillation cycle.
水
Not Analyzed
[ 1 Short Shorter < 2 % I 1 Long Shorter > 2 % _ _ Long Shorter < 2 % : No Change Short Longer < 2 % Short Longer > 2 % Long Longer < 2 % Long Longer > 2 %
Figure 4.6 Impact of climate change (Short/Long) and La Niña (Shorter/Longer) on cropland growing seasons in selected low-income countries, 1902-1997 (average percent change, by country). 6A. Estimated from regression models using the Southern Oscillation Index for the El Niño/Southern Oscillation cycle. 6B. Estimated from regression models using the Cold Tongue Index for the El Niño/Southern Oscillation cycle.
shortened the growing season in eight countries in Sub-Saharan Africa, and one country in North Africa.
Continue reading here:Global Food Demand
Was this article helpful?