Gas content in ice cores
Below the surface of a glacier or ice sheet, air bubbles become isolated and trapped during the transformation of snow into ice. If no diffusion occurs, the bubbles contain 'fossil' air from the time of the inclusion. The composition of the bubbles in ice cores therefore provides a way to analyse changes in the atmospheric composition several thousands of years back in time. The reconstruction of atmospheric C02 concentration from ice cores is, however, not straightforward, due to (a) possible C02production in the ice matrix as a result of chemical reactions
50,000
100,000
150,000
300,000
350,000
400,000
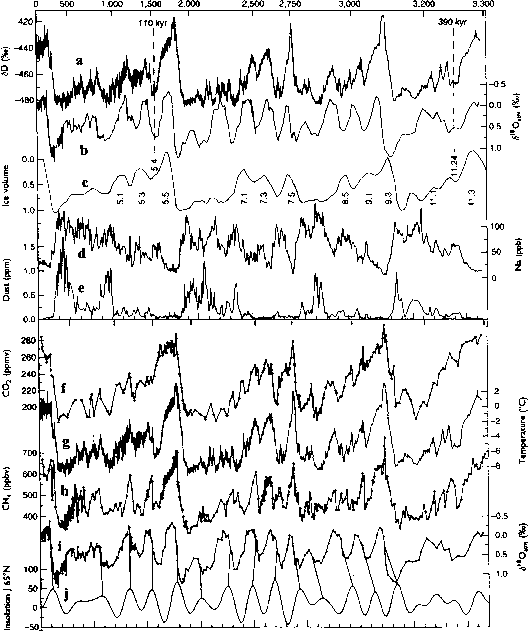
Figure 3.16 The Vostok ice core: depths on the top axis and time-scale on the lower axis with indication of the two fixed points at 110,000 and 390,000 yr bp. (a) Deuterium profile; (b) <518Oatm profile; (c) seawater <5lsO (ice volume proxy) andmarine isotope stages; (d) sodium profile; (e) dust profile; (f) C02; (g) isotopic temperature of the atmosphere; (h) CH4 (methane); (i) S1 Oatm; and (j) mid-June insolation at 65°N (in WrrT2). (Adapted from Petit et al, 1999)
50,000
100,000
150,000
300,000
350,000
400,000
Figure 3.16 The Vostok ice core: depths on the top axis and time-scale on the lower axis with indication of the two fixed points at 110,000 and 390,000 yr bp. (a) Deuterium profile; (b) <518Oatm profile; (c) seawater <5lsO (ice volume proxy) and marine isotope stages; (d) sodium profile; (e) dust profile; (f) C02; (g) isotopic temperature of the atmosphere; (h) CH4 (methane); (i) S1 Oatm; and (j) mid-June insolation at 65°N (in WrrT2). (Adapted from Petit et al, 1999)
0 400 800 1200 1600 2000
0 400 800 1200 1600 2000
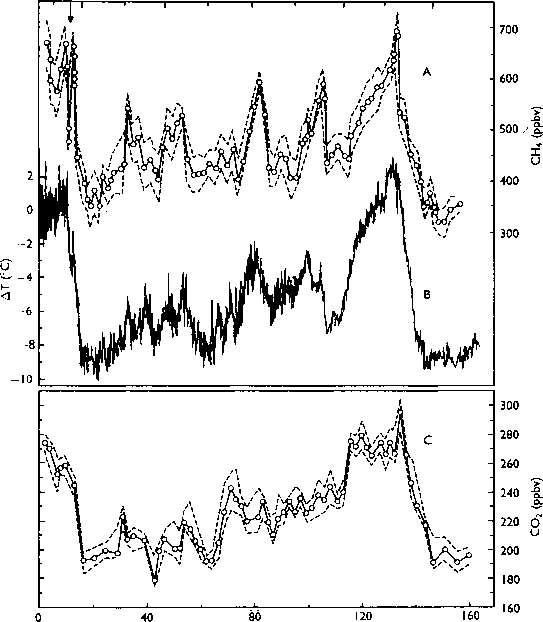
Figure 3.17 Palaeoenvironmental records from the Vostok ice core in Antarctica covering the last 160,000 years, (a) Methane content, mean values and 2-sigma uncertainty ranges; (b) surface palaeo-temperatures reconstructed from oxygen isotope variations; (c) variations in C02 content (average values and 2-sigma uncertainty ranges). (Adapted from Chappellaz et al, 1990)
Figure 3.17 Palaeoenvironmental records from the Vostok ice core in Antarctica covering the last 160,000 years, (a) Methane content, mean values and 2-sigma uncertainty ranges; (b) surface palaeo-temperatures reconstructed from oxygen isotope variations; (c) variations in C02 content (average values and 2-sigma uncertainty ranges). (Adapted from Chappellaz et al, 1990)
between impurities (Anklin et al, 1995), and (b) fractionation of C02 between bubbles and clath-rates (Miller, 1969).
Analyses of the air are made by placing a slice of the ice core in a vacuum chamber. Then the ice is cracked and the gases are analysed by chromatographic or spectrometric methods. In recent years, particular attention has been paid to the contents of the greenhouse gases CO2 and CH4.
To compare the rapid climate changes recorded in Greenland ice with the global trends in atmospheric CO2 concentrations as recorded in Antarctic ice, an accurate common time-scale for the last glacial period was provided by Stauffer et al. (1998) using the records of global atmospheric methane concentrations from both the Greenland and Antarctic ice sheets. They found that the atmospheric concentration of C02 generally varied little withDansgaard-Oeschger events, but varied significantly with Heinrich iceberg discharge events, especially those starting with a long Dansgaard-Oeschger event.
Records from both Greenland (Neftel et al., 1982; Stauffer et al, 1984) and Antarctica (Barnola et al, 1987, 1991) ice sheets indicate that during the last ice age, atmospheric C02 levels were significantly lower than during other interglacials. Other atmospheric gases, such as CH4 and nitrous oxide (NzO) have also been found in lower concentrations in ice from the last glacial maximum (Chappellaz et al, 1990; Raynaud et al, 1992). During the transition from the last glacial to the Holocene (oxygen isotope stage 2/1), the atmospheric C02 levels increased from about 200ppmv (parts per million by volume)一个间冰期值约为280 ppmv. The CH4 concentrations doubled from 350 to 650 ppbv, while N20 values increased from around 190 ppbv to 270 ppbv (see Fig. 2.3).
The Antarctic Vostok ice core shows that during the last 160,000 years, C02, CH4 and temperature (based on oxygen isotope data) have varied in phase (Fig. 3.17). Methane records from the Greenland ice cores (Dansgaard et al, 1993; Blunier et al, 1995) also demonstrate a close relationship with palaeotemperature records obtained from the ice cores.
上的气体含量ice core layersreflects human activity. A gradual increase in C02 in Greenland ice cores from the mid-eighteenth century and a significant increase during the last 50 years or so reflects the human impact on the atmospheric environment (Neftel et al, 1982). Increases in fossil fuel combustion, clearance of forests andconversion of biomassto C02 have increased the level of atmospheric C02 by 20-30 per cent over the last 200 years. Recently, concentrations of chemical pollutants (for example lead, soot, nitrates) have increased significantly (Mayewski et al, 1990).
A C02 record spanning the period between 40,000 and 8000 years bp was presented from the GRIP ice core (Anklin et al, 1997). Ice-core records showed an increase in the atmospheric C02 concentration of 80-100 ppmv from the last glacial maximum to the early Holocene, from 200 ppmv to 290-310 ppmv (Fig. 3.18). Both the GRIP and theGISP2 ice coresshow high C02 values in mild periods during the last glacial period. In Antarctica, however, the C02 ice-core records do not show similar high values. In addition, the early Holocene C02 values in the GRIP record are 20-30 ppmv higher than in the Antarctic records. The discrepancy between the GRIP and Antarctic C02 records was explained by Anklin et al (1997) as autochthonous production of excess C02 by impurities in the ice. Since the carbonate concentration in Antarctic ice is less than in Greenland ice, the C02 records from Antarctica are considered more reliable than the Greenland C02 records. High-resolution records from Antarctic ice cores show that carbon dioxide concentrations increased by 80 to 100 ppmv, 600 ± 400 years after each warming of the last three deglaciation periods (Fischer et al, 1999). High C02 concentrations can be sustained for thousands of years during glaciations despite strongly decreasing temperatures. The length of this phase lag is probably related to the duration of the preceding warm period, controlling the change in land coverage and build-up of the terrestrial biosphere.
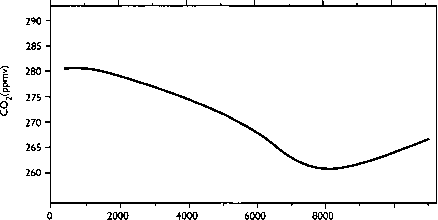
A high-resolution Holocene record of C02 concentrations measured in air bubbles trapped in an ice core from Taylor Dome, Antarctica,
MICROPARTICLES AND RADIOACTIVE TRACERS IN ICE CORES 35
-

- 160 — 320

Vostok Byrd
"' ■ ■ ■ I ■ ' ■ ' I ' ■ ' » I ■ ' ' « I ■ ' » ' I ' ■ ' ' I ' ■ ■ ' I
5000 10,000 15,000 20,000 25,000 30,000 35,000 40,000
Age (years bp)
Figure 3.18 The <5180 profile from the GRIP ice core versus age, and CO2 profiles from the GRIP, Dye 3, Byrd and Vostokdeep icecores. (Modified from Anklin et al, 1997)
shows a decrease of the C02 concentration from 3.4 Micropartides and radioactive
268ppmv at l0,500yrBP to 260ppmv at tracers in ice cores
8200 yr bp (Fig. 3.19). During the subsequent -
7000 years, the C02 concentration increased almost linearly to 285 ppmv (Indermuhle et al., Evidence of several aspects of environmental
1999). variation have been obtained from ice cores.
10000
Figure 3.19 Holocene C02 curve from Taylor Dome, Antarctica. (Modified from Indermiihle et al., 1999)
10000
Figure 3.19 Holocene C02 curve from Taylor Dome, Antarctica. (Modified from Indermiihle et al., 1999)
Changes inatmospheric aerosol loadingand the former extent of deserts or poorly vegetated areas have been detected using the dust content in ice cores (Jouzel et al., 1990). Dust, defined as a suspension of solid particles in a gas or a deposit of such particles, is an importantstratigraphie component in polar ice cores. Dust in the ice cores from Antarctica and Greenland is assumed to reflect the atmospheric dust burden at the time of deposition. Dust concentration in ice cores has been shown to vary seasonally. Annual dust cycles can thus help to identify annual layers of snow deposition, which can help to date the ice core. The presence of insoluble dust in polar ice means that annual insoluble dust maxima will be preserved and not affected by diffusion processes. Ram and Koenig (1997) presented a high-resolution dust profile from the GISP2 ice core through pre-Holocene ice, and also possibly penetratingEemianice, showing evidence of theDansgaard-Oeschger eventsrecorded in the oxygen isotope signal.
In the GRIP ice core, the mineralogical composition of atmospheric dust particles changes in phase with other palaeoatmospheric records (Maggi, 1997), indicating that climatic changes also affect the land surfaces of the dust source areas. Different mineralogical assemblages were systematically observed in cold and warm periods. During cold stages, quartz, illite, chlorite, micas and feldspars prevailed. This mineral assemblage is mainly related to mechanical weathering in arid andcold areas. Kaolinite and Fe (hydr)oxides dominated in warm periods, these minerals mainly being related to deep化学风化作用in warm and humid regions.
The size distribution of insoluble dust microparticles in the particle size interval 0.46 nm radius was measured in more than 1400 samples from the GRIP ice core (Steffensen, 1997), the total dust mass being strongly related to <5lsO variations. The volume distribution of the particles in the size interval 2.0-6.0 (xm was almost the same in most analysed samples. Analysis of dust from the GISP2 ice core from the interval between 23,340 and 26,180 yr bp (around the last glacial maximum) shows that the probable source area was in eastern Asia, and not from mid-continental USA or the Sahara, which were suggested as potential source areas (Biscaye et al, 1997).
The calcium (representing dust) concentration of the last 100,000 years from the GRIP ice core shows large variations (factor >100) (Fuhrer et al, 1998). A significant change (factor 5-10) between low concentrations during the Dansgaard-Oeschgerinterstadialperiods and high levels during colder periods is superimposed on a long-term trend with a further factor 5-10. Significantly higher wind velocities in the dust source area(s) in eastern Asia are probably required to explain these large and rapid increases in dust content. Changes in source area wind speed, almost entirely in phase with Greenland temperature changes, suggest that climatic parameters in high and low latitudes were strongly in phase during glacial periods, and that the atmospheric circulation system underwent almost simultaneous, large-scale variations during the last glacial period.
During the last glacial the dust content was about 200 times higher than at present (Thompson et al, 1995). Variations in the concentration of sea-salt particlesin ice cores are interpreted to reflect storminess (Shaw, 1989). Changes in sulphate in the Antarctic ice sheet have been used to indicate variations in biogenic productivity (Charleson et al, 1987). Acidity profiles in ice cores provide records of sulphuric acid content, a proxy of volcanic aerosols and therefore the magnitude of former volcanic eruptions. Ice cores also contain radioactive fallout from atmospheric nuclear bomb tests since the late 1950s and early 1960s, and the Chernobyl reactor accident in 1986. Certain fallouts are useful strati-graphic marker horizons which can be used, for example, inmass balance studies.
Ion chromatography of Ca, Mg and CI was used to study the cycle of marine and continental primary aerosols reaching Greenland (Angelis et al, 1997). Calcium is a good indicator of input from continental sources. The calcium content of continental background aerosols over Greenland was considerably higher during the glacial period. The marine Na component reflects sea-salt aerosols, showing an inverse linear relationship with <5lsO. The clorine to marine sodium weight ratio increases with temperature, from values close to the bulk seawater ratio during the last glacial maximum to significantly higher values during the Holocene.
A nearly continuous record of 10Be (half-life of 1.5 x 10⁶ years) concentrations was reported from the GISP2 ice core, spanning the interval between 3288 and 40,055 years bp (Finkel and Nishiizumi, 1997). 10Be concentrations show a strong correlation with ¿lsO and a more weak correlation with snow accumulation rate. There is a strong correlation between ¿l4C and 10 Be on a centennial time-scale.
Natural cosmogenic 36C1 is produced in the atmosphere mainly by neutron- and proton-induced spallation reactions on 40Ar. The production rate of 36C1 is proportional to the cosmic ray flux, which is modulated by the Earth's magnetic field and the magnetic properties of the solar wind. Within approximately two years, 36 CI is removed from the atmosphere and stored in terrestrial deposits such as ice sheets (e.g. Baumgartner et al, 1997). Except for the Holocene/Weichselian-Wisconsin transition, the GRIP ice core was analysed continuously for the cosmogenic isotopes 10Be, 36C1 and 26Al.
Continue reading here:Terminal moraines
Was this article helpful?
Readers' Questions
-
BRUNILDE2 months ago
- Reply
-
paul2 months ago
- Reply
-
dahlak1 year ago
- Reply